
CESE Screenshots
 PDF version PDF version |
Here are a few screenshots showing CESE stable in action.
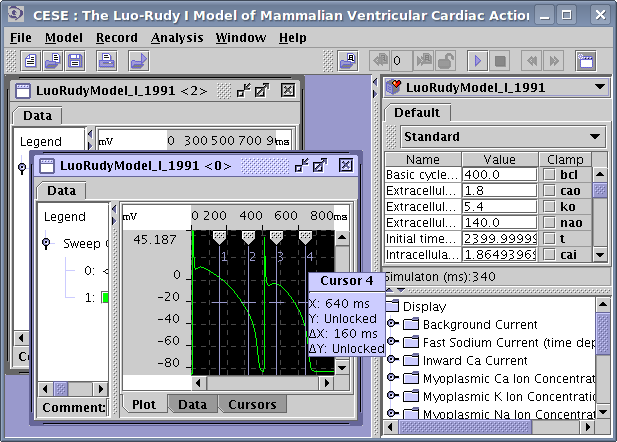
Main CESE window after 2 simulations. Results for each simulation are displayed in the separate window. The Luo-Rudy phase I model was used, and Membrane Voltage was selected for the visualization.
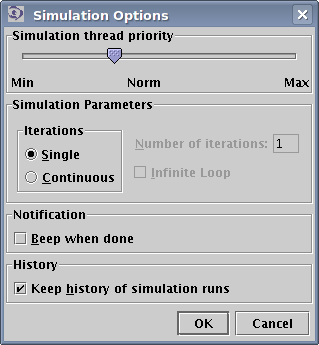
Simulation Options dialog. Here you can setup the simulation thread priority, and specify the number of simulations that will be performed when Start Simulation command is invoked.
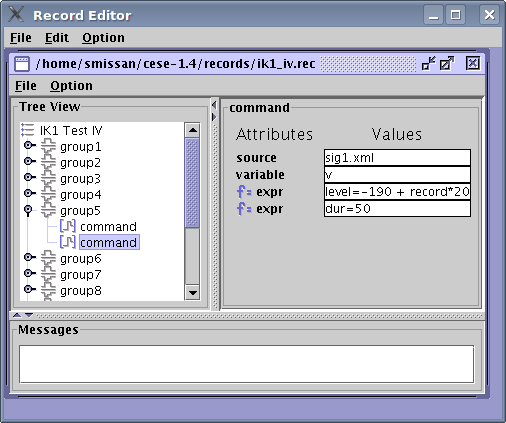
Record Editor is used to specify clamping commands. You connect certain model variable (in this case the Membrane Voltage — v) to the command file (sig1.xml). There are 13 groups in this file, we are changing Membrane Voltage in 20 mV increments to generate the I-V.
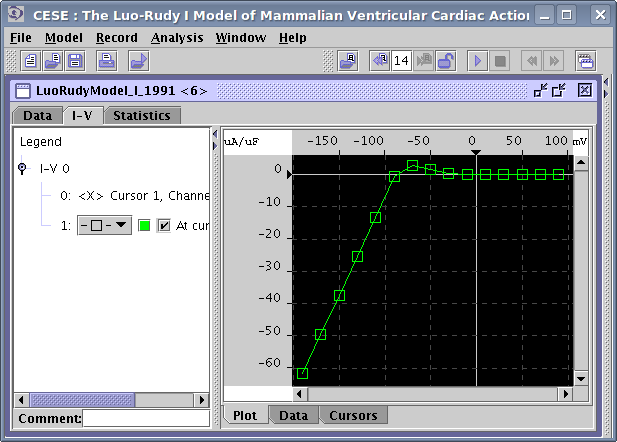
CESE just finished to perform a series of simulations using the clamp command shown in the previous screenshot. We have plotted the I-V using cursors to specify the measurement region. Note that the I-V plot was added to the same window where our source data is displayed (tabs Data and I-V). Visual parameters of the plot can be controlled — note the panel on the left side of the window.